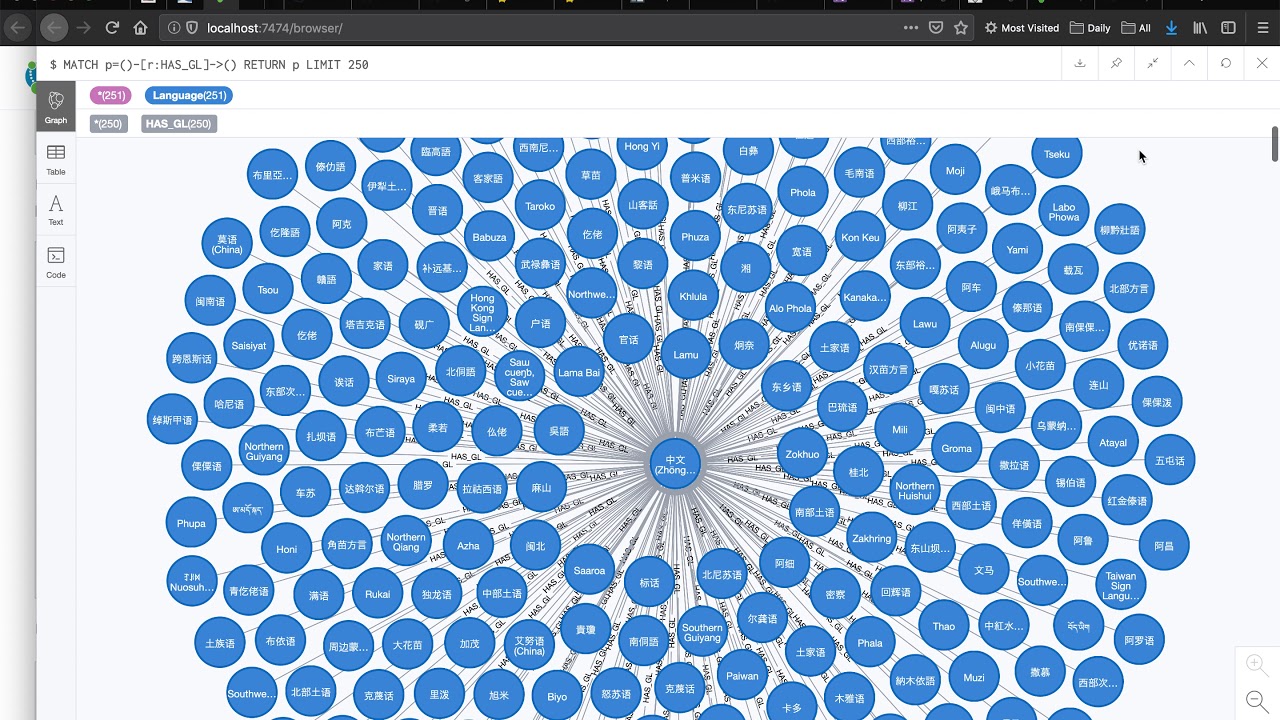
Visualizing the relationships between Gateway Languages (GLs) and languages that are behind the GLs has proved to be a complicated endeavor. It’s not that it is impossible, it’s just difficult to model the relationships in a way that is useful to someone wanting to explore the relationships.
Recently we’ve been exploring with Neo4j and I was able to get the basic tD data into Neo4j for some testing. The good news is that using a graph database like Neo4j is a good way to encode the relationships between the languages. The bad news is that visualizing it in a useful way is still difficult, due to the amount of nodes. Below is a short screencast showing how to load and visualize a randomly chosen GL ↔ OL relationship.
If you want to try this yourself, you can follow the steps in the Github repo below. It would be great to get some people looking into how this could be better visualized, probably using something outside of Neo4j, perhaps d3.js directly? I think that we need the ability to zoom in and out of particular regions and language clusters.
What other ways could this be done effectively?
